nEDM Interface
Tutorials
Modules
Classes
Externals
Monitoring pages
Monitor pages
Monitor pages from each subsystem provide a way to monitor live data arriving, as well as plot past data records.
The monitor pages for a given susbsystem are always available at:
http://db.nedm1/page/monitor/nedm/[sub_system_name]The variables shown and the size of the plots will be saved in localStorage
and loaded the next time the browser is opened. (Note : it is not yet
possible to save the time ranges, so all variables/plots saved in this way will
be loaded as live with a ten-minute window.)
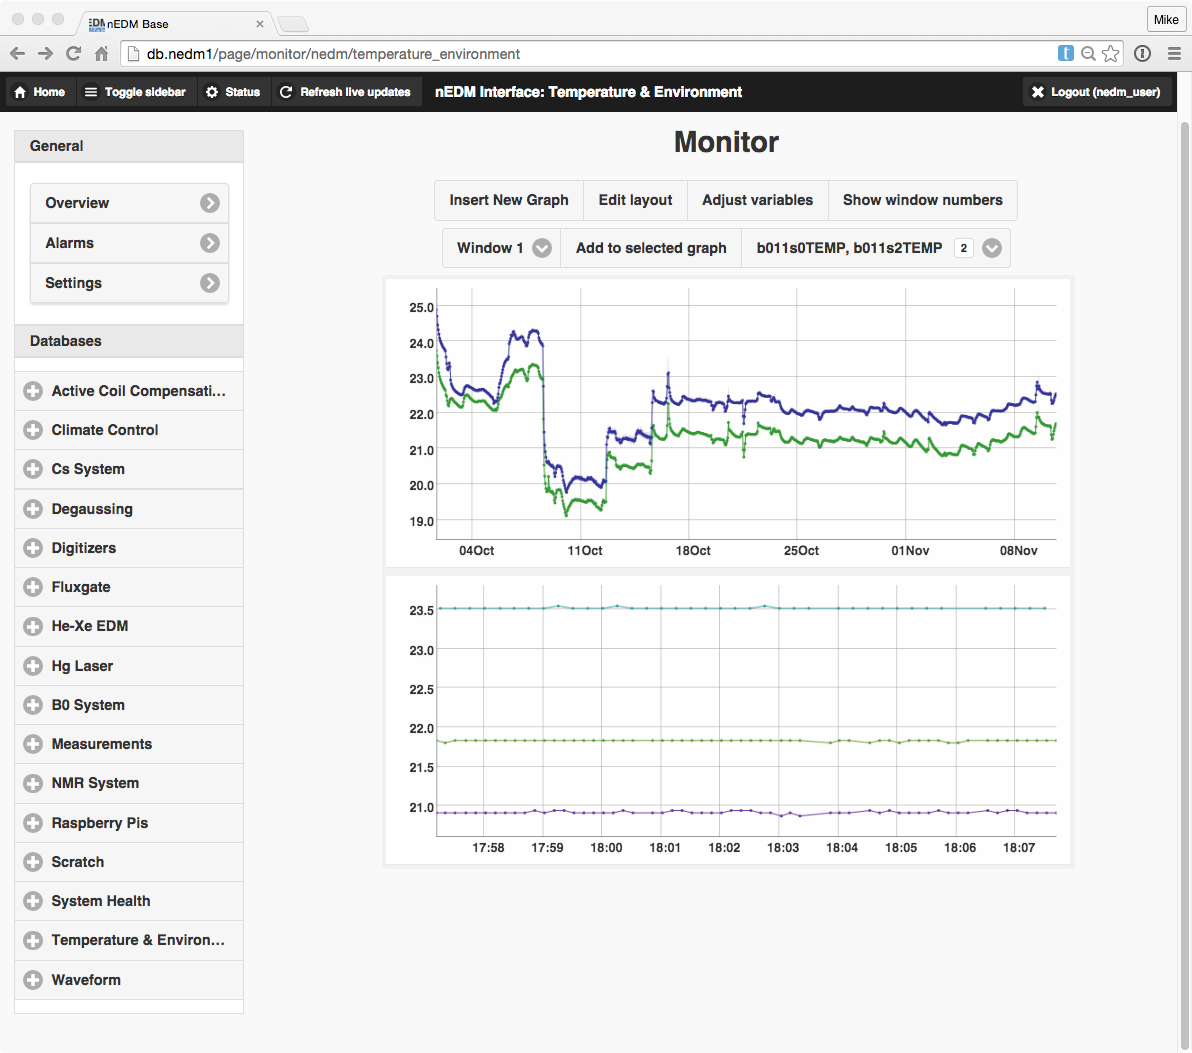
A basic page looks like the following:
One can add variables using the drop-down selector on the bottom right. Click
on Add to selected graph to add those to the graph selected in the drop-down
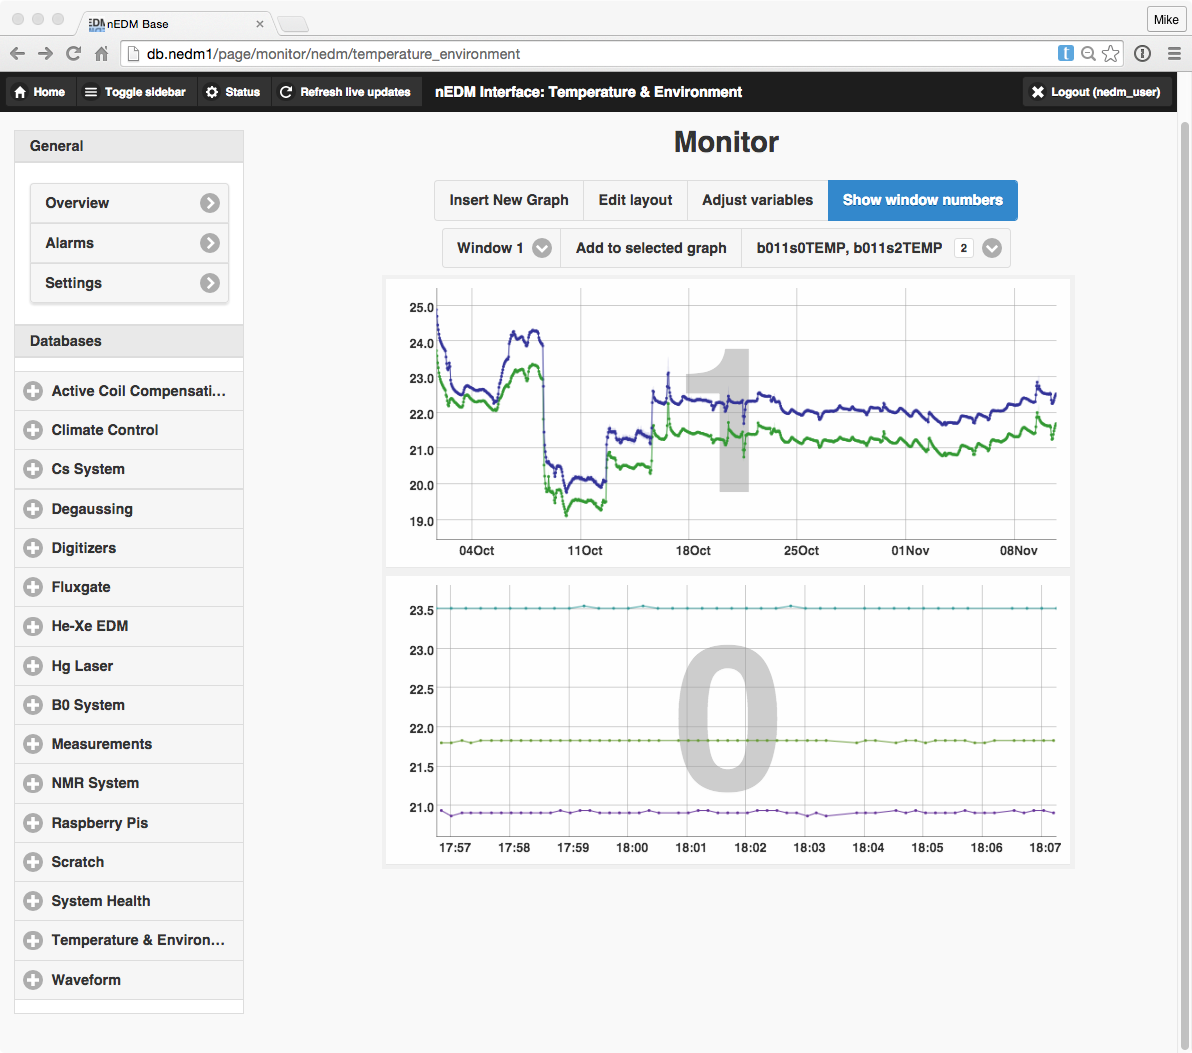
selector on the bottom left. To see which number corresponds to which plot,
click on Show window numbers:
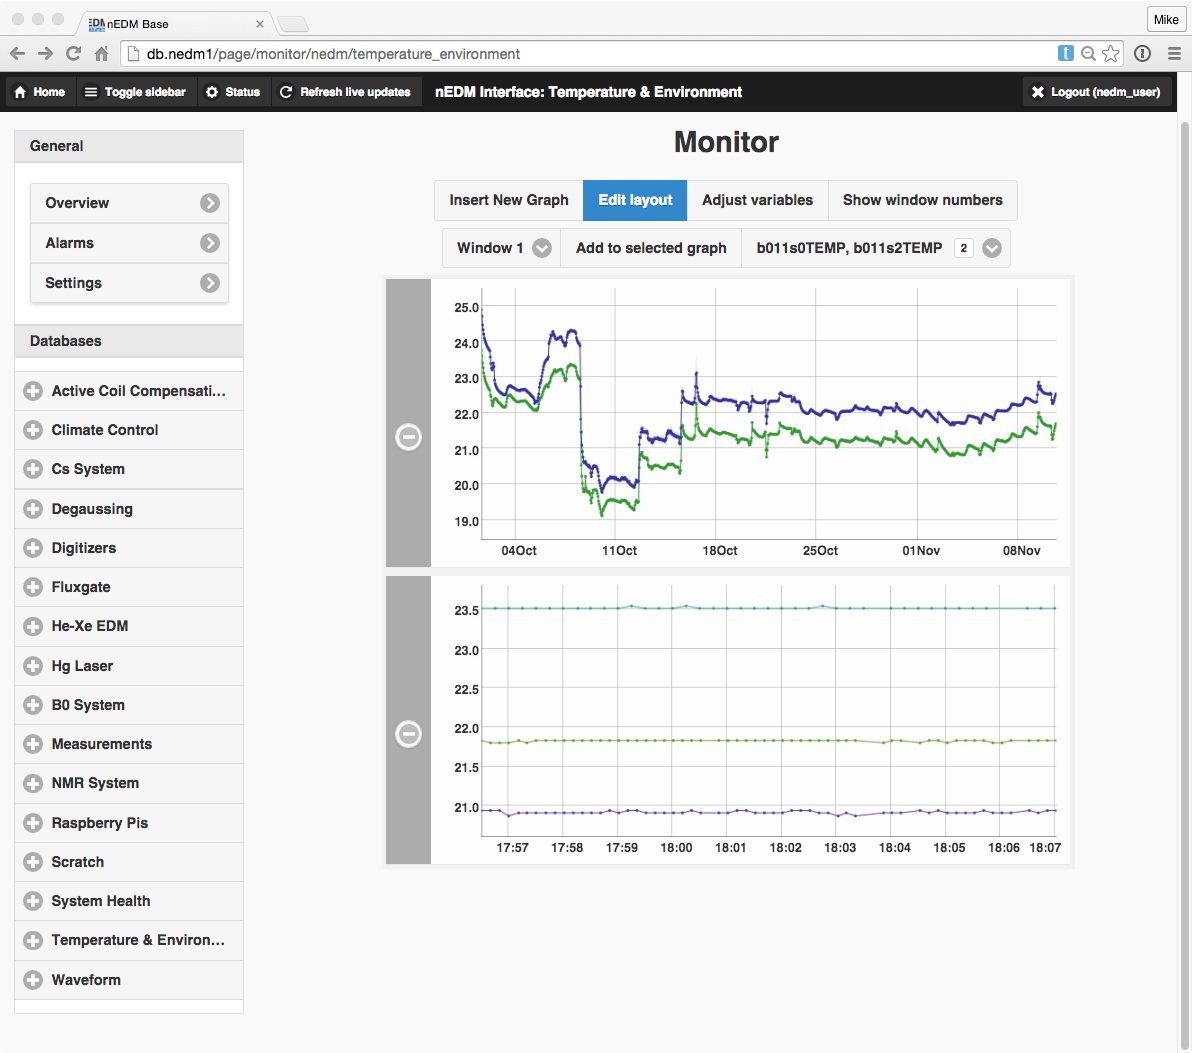
One can edit the layout, including moving the plots side-to-side or changing
their size by clicking on Edit layout. (Drag from the bottom-righthand
corner of each plot to change the size, and click on the minus to the lift to
remove the plot.)
Finally, to adjust the time range of the variables, or to remove variables from
the plot, click on Adjust variables. This will open up a view for each plot
as shown in the following:
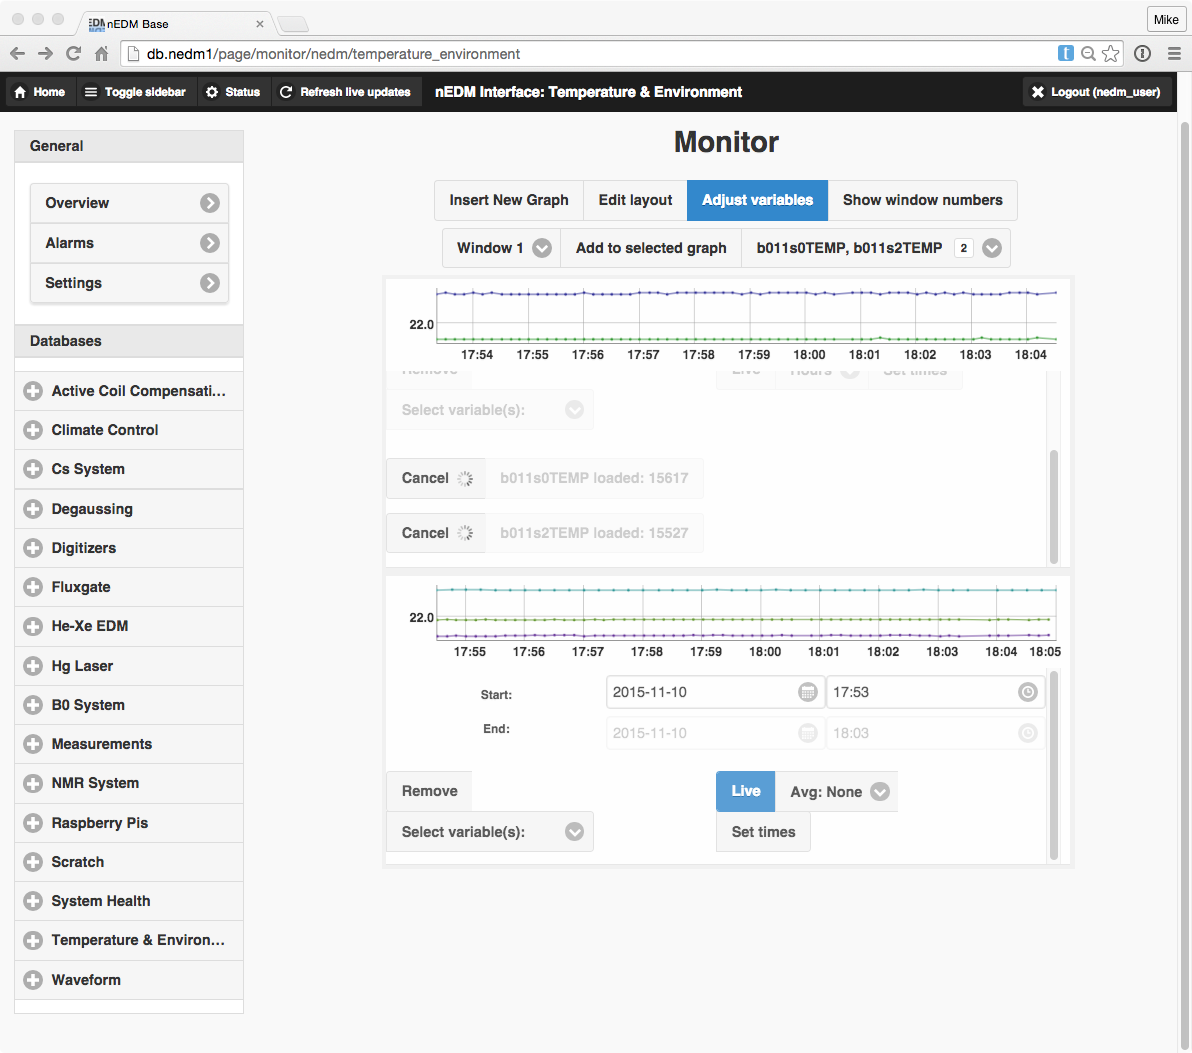
To note, click on Live to set the plot to update on the arrival of new data.
IMPORTANT: when selecting a large time range, use the averaging (either over
minutes, hours, day, or months) functions. The extremes will still be shown as
shaded regions, so that this is still an effective way to search for outliers.